
The Most Targeted Oil & Gas ‘Subsidies’ Aren’t Subsidies at All
More than 50 lawmakers are pushing for the repeal of oil and natural gas industry “subsidies” as part of the budget reconciliation bill currently being hashed out in Congress. But ironically, the two most notable “subsidies” in their crosshairs – the expensing of intangible drilling costs (IDCs) and the percentage depletion allowance – aren’t subsidies at all.
A subsidy is defined as “a sum of money granted by the government or a public body to assist an industry or business so that the price of a commodity or service may remain low or competitive.” In other words – a direct government handout. IDCs and percentage depletion are in no way, shape or form government handouts. They are actually tax provisions that have been part of the United States tax code for 108 and 95 years, respectively. The U.S. tax code has always allowed the oil and gas industry, along with a vast majority of the manufacturing sector and households, to utilize tax provisions so that they are only taxed on net income.
IDCs and percentage depletion are also anything but “Big Oil” tax breaks. IDC deductions and percentage depletion are used almost exclusively by small, independent producers who produce less 1,000 barrels of oil per day (BOPD). In Illinois, all but four of the state’s 1,500 operators produce less than 1,000 BOPD. The 50-plus lawmakers targeting these tax provisions say they “simply enhance profits of fossil fuel companies” and do “nothing” to create jobs and reduce dependence on foreign oil, but the opposite is true.
Intangible drilling costs are expenses associated with drilling a well that cannot be salvaged, including employee wages, contract labor, fuel and service costs. All told, they account for roughly 85 percent of an oil and gas producers’ total expenses, according to The Petroleum Alliance of Oklahoma. Small oil producers, like almost all businesses, are able to deduct these ordinary business expenses from their gross income so that they are taxed only on their net income. The Petroleum Alliance of Oklahoma estimates the elimination of intangible drilling costs would result in an immediate 25 percent tax hike on oil and gas producers and a similar reduction in drilling activity.
Percentage depletion is very similar to the non-mineral depreciation deduction that all U.S. companies are allowed to utilize. It can only be used by only the smallest oil and gas companies that make less than 1,000 BOPD and wells making less than 15 BOPD. Oil and gas producers should be the last companies denied the ability to depreciate their assets, considering oil reserves are a textbook definition of a depleting asset. Unlike assets such as a building or machinery, which can retain value even when they depreciate to zero value for tax purposes, oil and gas wells not only eventually lose all value as they become exhausted, but incur costs because they have to be plugged and abandoned. Percentage depletion allows small oil companies to plan for plugging and abandoning wells in addition to retaining a portion of their earnings.
The only way for an oil producer to replace depleting resources is to drill new wells. Otherwise, they go out of business – plain and simple. And considering drilling wells is an inherently risky endeavor (only about 60 percent of wells drilled are successful) these tax provisions are fundamentally necessary and appropriate. After all, deducting the cost of doing business is standard practice for all businesses, and oil and gas companies pay every dime of tax revenue they owe. In fact, the American Petroleum Institute notes that the U.S. oil and gas industry paid an effective tax rate of 34 percent between 2013 and 2017, compared to 26.7 percent for the S&P industrials.
Despite the narrative that fossil fuel companies are heavily subsidized, a recent analysis by the non-partisan Energy Information Administration (EIA) found that in Financial Year 2016, oil, natural gas and coal companies received just seven percent of federal energy subsidies despite supplying 78 percent of the country’s energy. On the other hand, the analysis found renewable, nuclear energy and other non-carbon energy industries obtained 93 percent of federal energy fuel subsidies in FY2016 despite generating just 22 percent of the country’s energy.
Much has been said and written about oil and natural gas “subsidies” lately. But often overlooked is the fact the two most talked about “subsidies,” intangible drilling costs and percentage depletion, aren’t subsidies at all. Without them, the small oil producers most prominent in the Illinois Basin would not be able to continue producing the oil, jobs, tax revenue and royalty income our state and country need now more than ever.

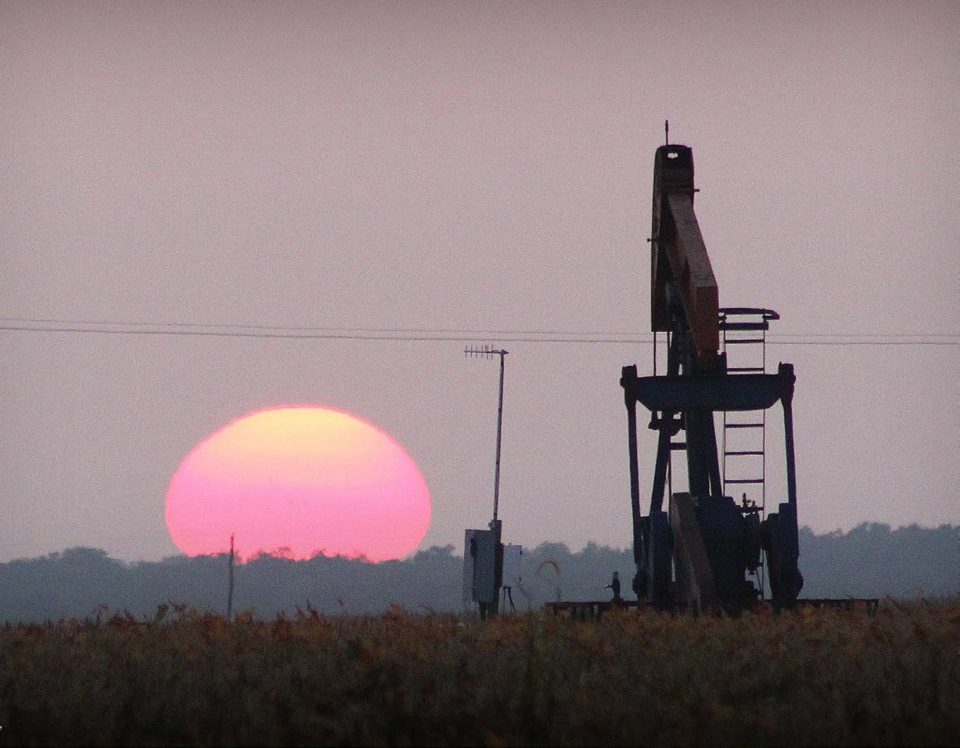
We Need More Oil From American Soil – Not From OPEC and Russia
It has been said many times before, but – to the delight of Vladimir Putin and Saudi Arabia Crown Prince Mohammed bin Salman – remains difficult for many U.S. policymakers to grasp: Reducing domestic oil production does nothing to decrease demand. Instead, it leads to increased dependence on the Organization of the Petroleum Exporting Countries (OPEC), Russia and other foreign sources for the oil we need.
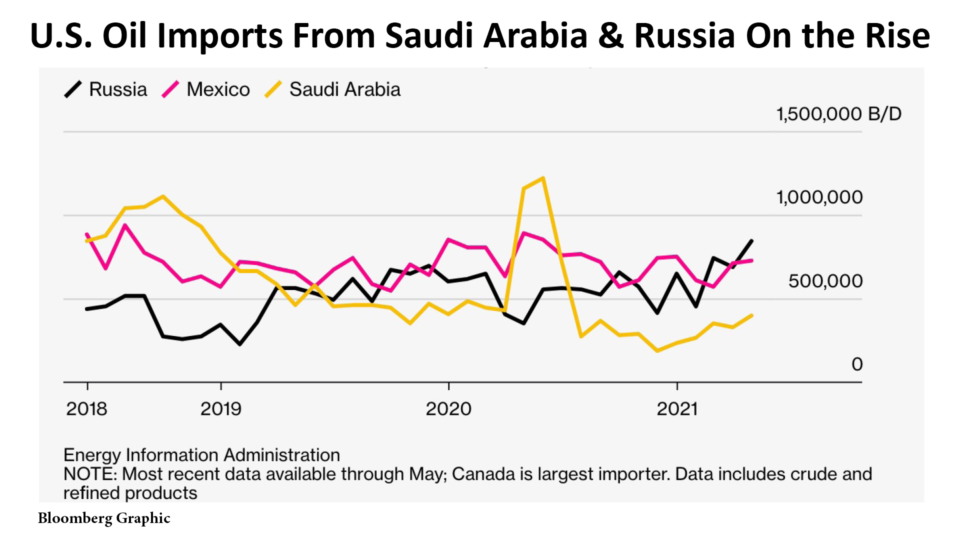
As U.S. oil demand has surged to record levels this summer, policies implemented to deliberately decrease or discourage American oil production have resulted in imports from OPEC nearly doubling from pre-pandemic levels. U.S. oil imports from Russia – which is now in cahoots with OPEC as the most notable “+” in the OPEC+ alliance – have also surged. Russia now supplies more oil to the U.S. than any other foreign source aside from Canada.
Incredibly, just eight months after our OPEC imports fell to their lowest level since 1973, the White House recently begged the infamous cartel to increase oil output to keep gasoline prices from soaring ever closer to $4 a gallon.
We’ve been at the mercy of OPEC before. The oil embargo and gasoline shortage crisis of the 1970s and record OPEC imports and $4 pump prices endured earlier this century are just a couple examples. But there is a big difference this time around – we are now under OPEC’s thumb by choice. America now has the ability to ramp up domestic oil production to keep energy costs affordable, but we have instead turned to an international foreign cartel for relief.
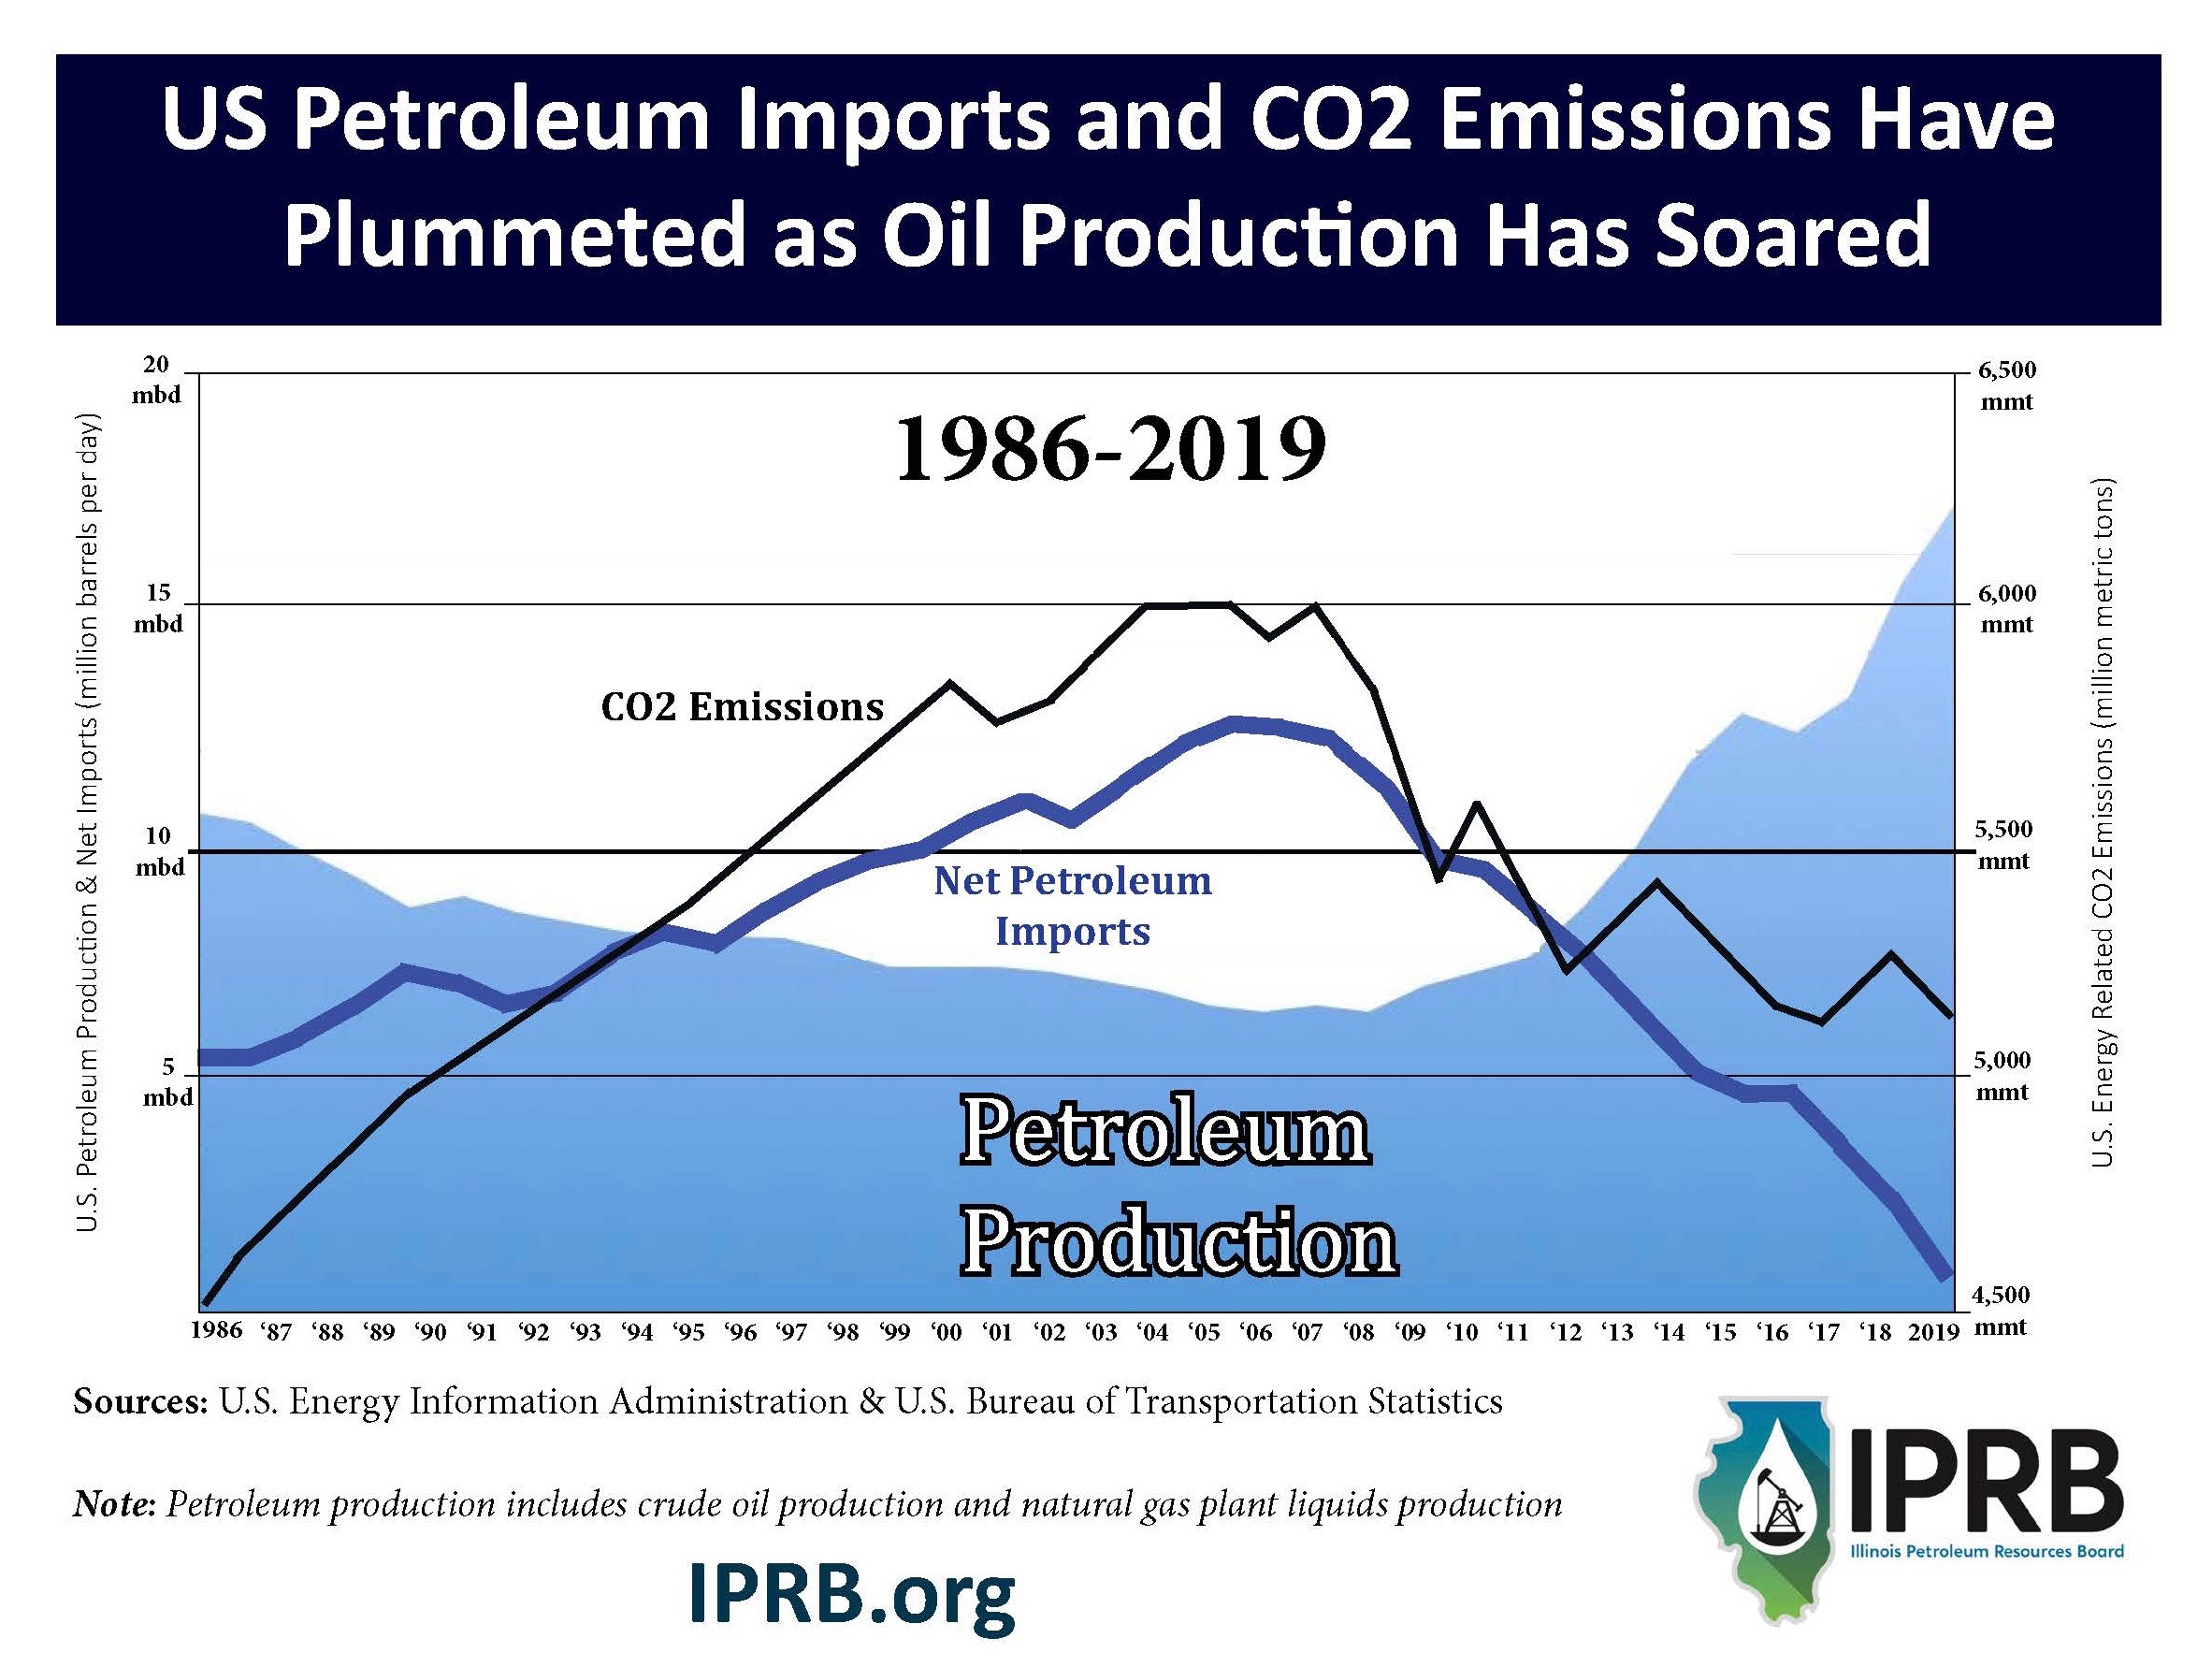
The justification for these policies is the belief that constraining U.S. oil and natural gas production will drive down greenhouse gas emissions and help combat climate change. But the disconnect between the intended outcomes and reality is quite stark. Not only do these policies continue to increase energy costs and forfeit our hard-won energy independence, they increase greenhouse gas emissions as well.
Every barrel of oil we choose not to produce in the United States and instead import from overseas increases our carbon footprint, considering imported oil has to be shipped by boat from countries with far more lenient environmental regulations than our own. The same can be said for oil that is transported by rail or truck rather than pipeline, which is why the shutdown of the Keystone XL pipeline makes similarly little sense.
Since reaching a record 13 million barrels per day prior to the pandemic, U.S. oil production has been down about 1.6 million barrels per day this summer. But U.S. oil demand has bounced back to pre-pandemic levels and isn’t expected to wane any time soon.
In fact, the Energy Information Administration (EIA) expects oil to remain the United States’ primary energy source through at least midcentury. The EIA’s projection even takes into account low renewable energy costs and continued renewable energy growth moving forward.
It’s not difficult to see why the EIA is bullish on oil demand. Not only is overall energy demand growing at a faster pace than renewable energy growth – highlighting the fact that renewables are merely a supplemental energy source rather than a replacement traditional energy – more than 55 percent of U.S. petroleum demand is non-gasoline and has no scalable substitute. Even if the 265 million gasoline- and diesel-powered vehicles currently on American roadways disappeared tomorrow, we would still need a lot of oil for many years to come for the 6,000-plus petroleum-based products we use everyday. For instance, petroleum-based feedstocks used to make personal protective equipment for healthcare workers and packaging for products shipped via Amazon and other e-commerce companies are currently driving oil demand growth.
U.S. oil demand will remain strong for decades and the most realistic way to resume the recent the unprecedented combination of low energy costs, economic growth and emissions reductions is producing as much oil and natural gas on American soil as possible. Outsourcing our energy needs to OPEC and other hostile sources will only lead to higher pump prices, increased emissions and Putin and Crown Prince Salman exchanging more high-fives for years to come.


Illinois Oil Production Just Under 3.65 Million Barrels in First Half of 2021
Illinois crude oil production totaled 3,647,520 barrels in the first half of 2021, according to reports submitted to the Illinois Petroleum Resources Board (IPRB) by Illinois first purchasers. Click here to download our first half 2021 Illinois oil production report.
Average daily oil production in the state was 20,264 barrels per day in the first half of the year, a slight 0.7 percent increase from the same time period last year. Monthly state production has consistently been between 615,000 to 640,000 barrels so far this year, with February (466,864 barrels) being an outlier, primarily because of extreme cold weather that drove some production offline for a significant time.
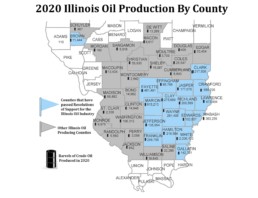
White County remains by far Illinois’ top oil producing county, totaling 1,053,888 barrels of production in the first half of 2021. That represents just under 29 percent of the state’s total production for the first half of the year. White County is on pace to surpass 2 million barrels of annual production for the third straight year.
The other top-10 producing counties in the first half of 2021 were Marion (379,948 barrels), Crawford (303,660), Fayette (233,792), Lawrence (210,689), Wabash (174,253), Franklin (151,904), Wayne (138,300), Clay (137,326) and Clark (106,172). Forty-three Illinois counties produced oil in the first half of the year, with the top-15 producing counties again accounting for more than 90 percent of the state’s total production. All 15 of those counties have passed resolutions of support for the Illinois oil production industry.
Illinois Oil Has Played Big Role in Securing American Freedom and Prosperity
As America celebrates this Fourth of July weekend, it is important to remember what has made the enduring freedoms and prosperity we all enjoy possible.
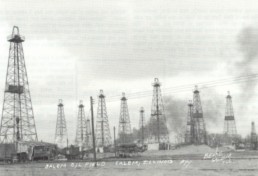
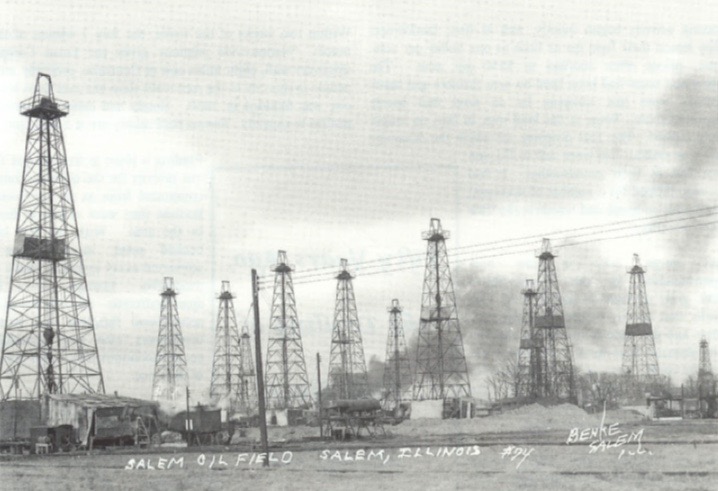
It is widely understood the United States and the free world as we know it would be a much worse place if not for the nearly incomprehensible efforts and sacrifice of the Greatest Generation during World War II. But less understood is the fact that their valiant struggle to defeat the Axis Powers was literally fueled by abundant American oil – much of it produced right here in Illinois.
Six out of seven barrels of oil consumed by the Allied Forces during WWII was produced in the United States. Oil was absolutely essential to the war effort, as it was needed to fuel tanks, military vehicles and aircraft. It was also used to make TNT, synthetic rubber for tires, runways and lubricant for guns, just to name a few of its myriad of applications. Historians widely agree that it was largely because Germany and Japan were both severely lacking in domestic petroleum resources that their war machine literally ground to a halt. The United States, in contrast, produced half of the world’s oil during this time, providing an undeniable advantage for the Allied Forces. A prominent German marshal even listed his country's oil deficiencies as one of the three primary reasons they lost the war.
Illinois was a top-10 oil producing state during this time, totaling 470 million barrels of production from 1941 to 1945, six percent of overall U.S. production. The Land of Lincoln was also home to the critical “Big Inch” pipeline that delivered more than half of the oil used by the United States during World War II. The pipeline, which replaced ocean tankers that had become easy targets for German U-boats, terminated in Norris City, where oil was stored in more than a dozen 80,000-barrel storage tanks and eventually distributed to numerous east coast refineries. The “Big Inch” allowed for the safe and timely transportation of oil for the war effort, helping turn the tide to the Allied Forces’ favor.
Although much has changed in the decades since World War II, one thing has remained the same – the world still runs on oil and will continue to for many decades to come. Though the “energy transition” narrative is in vogue and policies are deliberately being implemented to decrease domestic oil production and stop pipeline projects, access to our considerable oil and natural gas reserves remains essential to ensuring our national security. That is why just a year after the United States became a net petroleum exporter on an annual basis for the first time on record, our adversaries in Russia, China and the Middle East are no doubt looking on with delight as pipeline construction projects continue to be cancelled or delayed and our oil imports have spiked dramatically so far this year.
Pipelines remain the safest, most efficient and least carbon-intensive method of transporting crude oil, but given the recent cancellation of the Keystone XL pipeline and potential shutdown of the Dakota Access Pipeline, it seems possible that if the “Big Inch” pipeline were proposed today, it would never be constructed. Likewise, if military threats similar to those posed by Germany and Russia in the 1940s emerged today, it’s difficult to imagine widespread support for the increased domestic oil production our military would need to counter it.
Fortunately, such thinking was not prevalent during World War II – and the world is much better off for it. But the fact that such might not be the case today is a sobering reminder of just how fragile the freedom and prosperity we’ll be celebrating this Independence Day weekend really is. History teaches us that America needs American oil. That said, we should produce as much of the oil we need here in Illinois and throughout the United States as possible to ensure our way of life is protected.
IEA Report Recommendations Would Destroy US Energy Security if Implemented
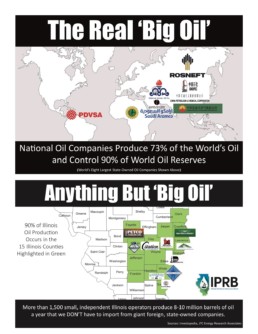
State-owned national oil companies already produce nearly three-quarters of the world’s oil and control 90 percent of its proven reserves. The only thing keeping these true “Big Oil” giants from completely controlling the world’s hydrocarbon supply are the privately-owned, independent oil companies that dominate the Illinois Basin and the United States as a whole.
It is with that fact in mind that the recommendations of a recent International Energy Agency (IEA) report pose such a threat to the United States’ hard-won, decades-long struggle to achieve energy independence.
The IEA calls for no new investments in oil and gas-related projects in order to meet net-zero greenhouse gas emissions by 2050. It is a recommendation that will no doubt be completely ignored by the Saudi Aramcos, Rosnefts (Russia) and National Iranian Oil Corporations of the world, while emboldening “Keep It In the Ground” calls for divestment from independent oil and gas producers and publicly traded multi-national companies based here in the United States.
That is terrible news for the energy security of the United States, namely because even the IEA acknowledges the world is going to need a lot of oil for many decades to come. As Cyril Widdershoven writes for Oilprice.com,“A fully renewable, sustainable, and stable world before 2050 is not something that can be achieved without oil and gas for both petrochemicals and energy” and “[w]ithout independents, all power will fall into the hands of national producers.”
The IEA even acknowledges that if its recommendations are acted on, the OPEC cartel’s share of global oil supply will jump from 37 percent to 52 percent in 2050, an all-time high. This would leave the United States heavily reliant on hostile foreign sources for both its traditional and renewable energy needs (China enjoys a virtual monopoly on critical mineral supply chains needed for alternative energy infrastructure).
It’s often been said that doing the same thing over and over again and expecting different results is the definition of insanity. But it’s even crazier to voluntarily recreate a foreign energy-reliance scenario that has had dire consequences in the past and expect a positive outcome this time around.
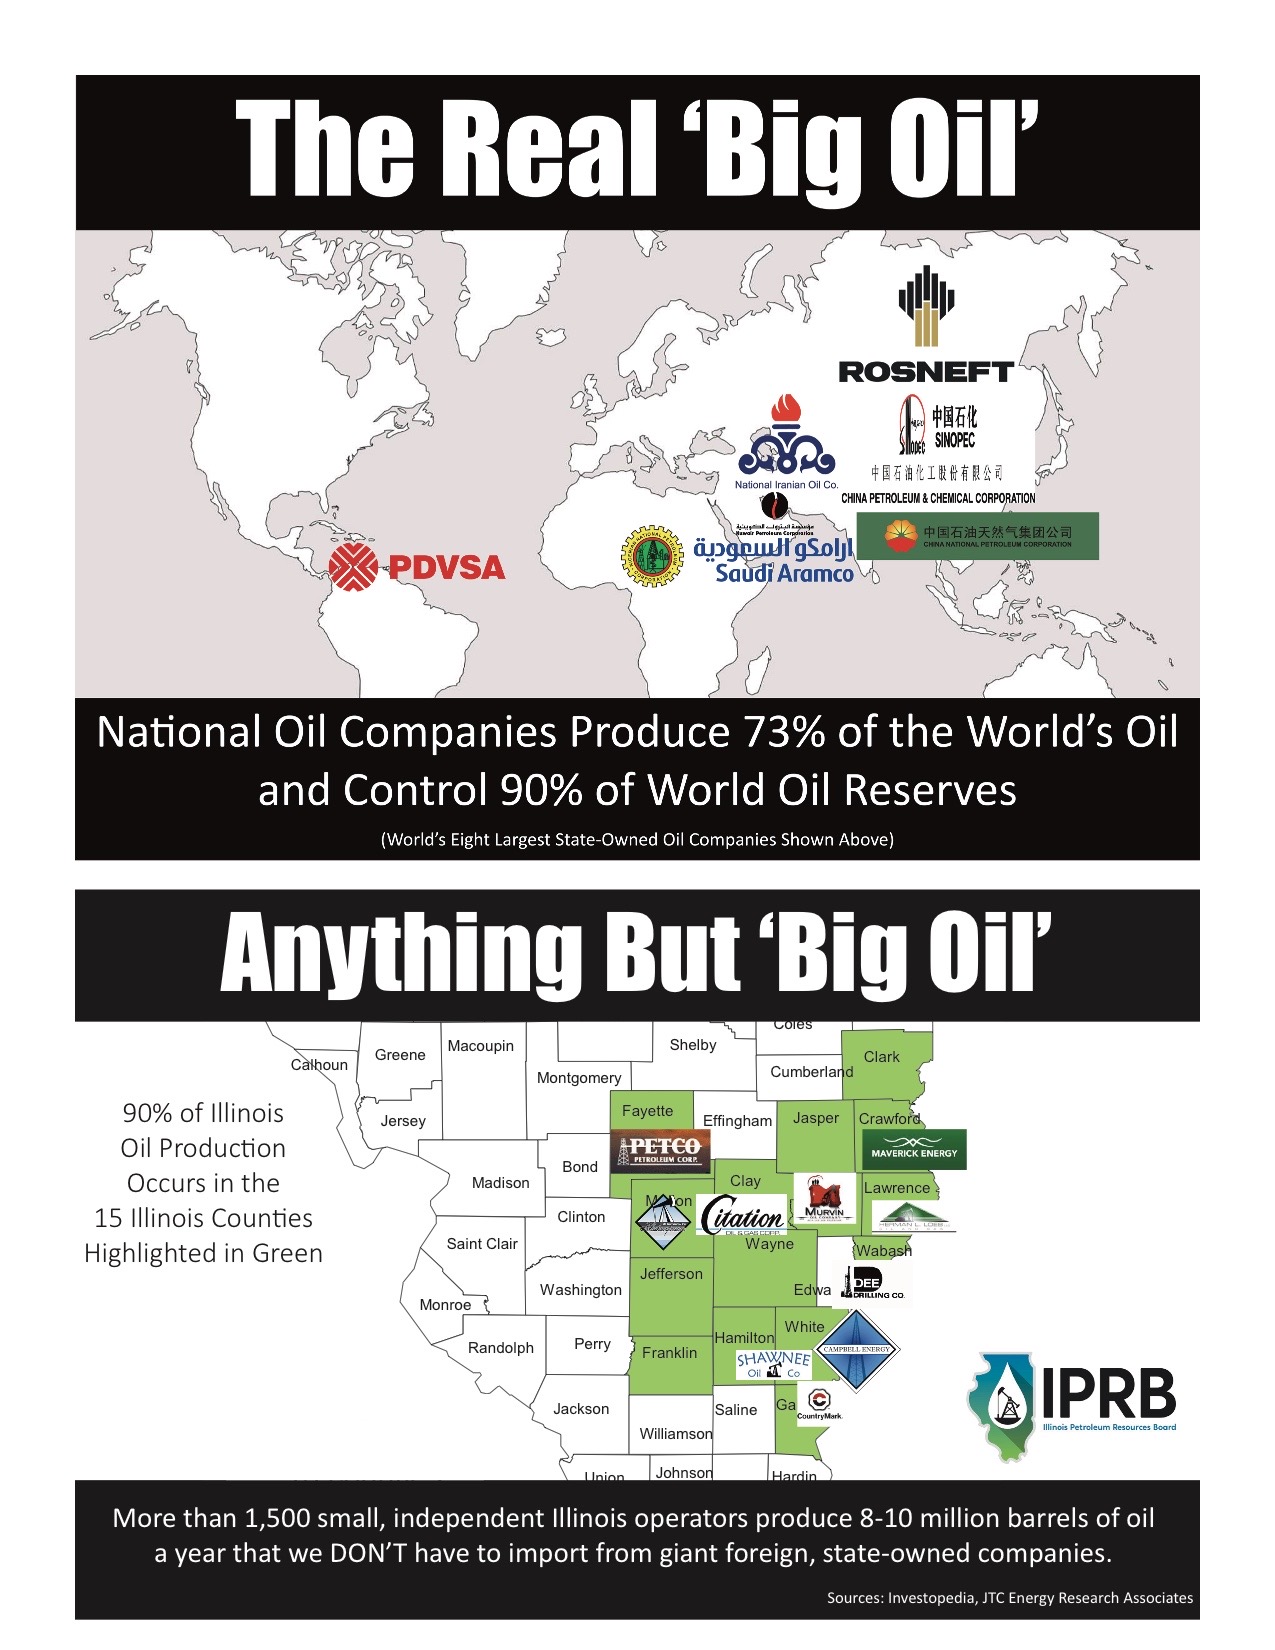
It was just 16 years ago that nearly half of the record 10.1 million barrels a day of crude oil the U.S. imported came from OPEC cartel.
We were under the cartel’s thumb for decades, indirectly or directly resulting in numerous bloody foreign entanglements and infamous long lines at the pumps. With OPEC’s energy-driven geopolitical leverage over the United States as a prime motivator, eight different U.S. presidents strived for energy independence. The goal was finally achieved last year, when we became a net petroleum exporter for the first time on record and saw our crude oil imports from OPEC fall to their lowest levels since 1973. Remarkably, at the same time the United States achieved energy independence, it also managed to lead the world in carbon dioxide emissions (CO2) reductions.
Global CO2 reductions are at the core of the IEA’s recommendations. But the fact remains that the U.S. oil demand will remain strong for decades and the most realistic way to continue the historic decoupling trends of economic growth and emissions reductions is producing as much oil and natural gas here as possible.
Returning to the days of importing a large share of the oil we use from OPEC and other state-owned sources will not only weaken our geopolitical standing, but result in higher emissions, considering state-owned oil companies are subject to far more relaxed environmental standards than companies here in the U.S.
Soon after the IEA’s report was released, energy companies in Asia, Japan and the Philippines rejected the organization’s conclusion that stopping new oil and gas investment and ceding market share to OPEC is the ideal path to net-zero emissions. The United States should do the same. Not only are the IEA’s recommendations unrealistic, they would further embolden true “Big Oil” state-owned giants who would love nothing more than to have the United States once again under their collective thumbs.

Why Oil & Gas Workers Aren’t Too Keen on the ‘Just Transition’ Narrative
With their industry under assault, oil and gas workers are being assured they can simply transition to renewable energy jobs. John Kerry even recently quipped that oil and gas workers “can be the people who go to work to make solar panels.” Easy peasy, apparently.
So why is this “just transition” narrative being met with deep skepticism and even anger from oil and gas workers? Because the notion that a simple “transition” to jobs that typically pay less – or don’t even exist at all – is as misguided as the belief we can quickly pivot to 100 percent renewable energy.
A recent Energy Information Administration report provides a reality-check, finding the United States will likely continue to rely on oil and natural gas for just under 70 percent of its energy needs through at least 2050. Despite all the talk of the “end of oil” the EIA forecasts that “petroleum remains the most-consumed fuel in the United States” for decades. Department of the Interior Secretary Deb Haaland recently echoed the report’s findings, testifying, “There’s no question that fossil energy does and will continue to play a major role in America for years to come.”
So contrary to the “just transition” narrative, a robust U.S. oil and gas industry workforce will be needed for years to come – including Illinois’ proud oil and gas workforce.
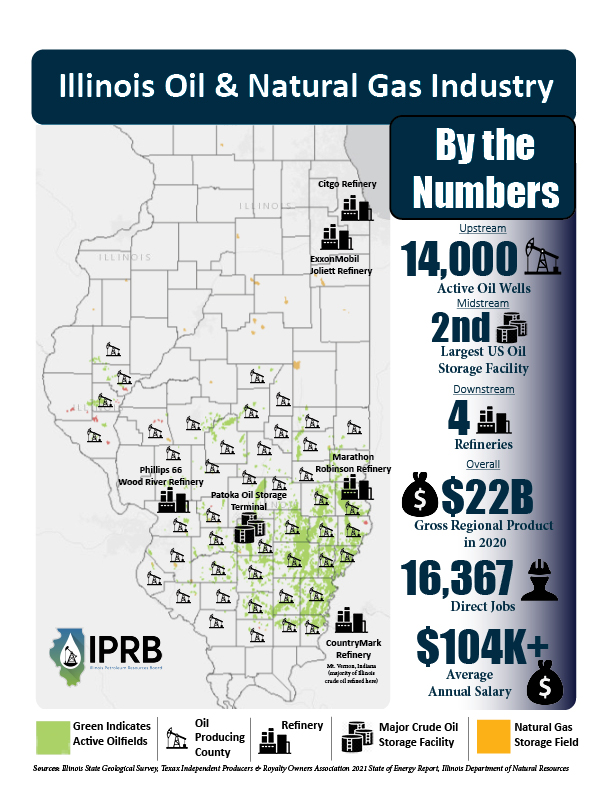
Though most folks probably don’t think of Illinois as a major oil and gas industry state, a recent Texas Independent Producers & Royalty Owners Association (TIPRO) report serves as a reminder that the Land of Lincoln is home to four refineries, the second-largest crude oil storage facility in the country and an oil production industry that dates back more than a century. TIPRO finds the Illinois oil and gas industry generated $22 billion in economic activity last year, three percent of the state’s overall economy. The report also finds there were not only 16,000-plus oil and gas jobs in Illinois last year – 10th most in the country – but that those jobs paid an average salary of more than $104,000, 65 percent higher than the private sector average.
No wonder Illinois oil and gas workers aren’t clamoring to “transition” to renewable energy industry jobs that pay less and are far more temporary in nature. As Politico reported this week, a new report by the National Association of State Energy Officials (NASEO), the Energy Futures Initiative, and BW Research Partnership finds that, “Workers in the greener side of the energy industry earn significantly less than those who extract fossil fuels and run power plants…”
The report finds that U.S. oil industry workers earn a median wage of $26.59 per hour, while oil workers in the mining/extraction sectors specifically have a median wage of $37.67 per hour. The median wage for wind and solar industry workers is $25.95 per hour and $24.48 per hour, respectively.
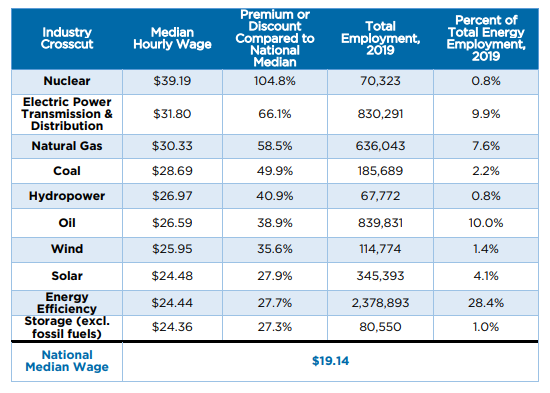 U.S. Bureau of Labor Statistics data show the most abundant U.S. “green” energy occupations – wind turbine technician and solar panel technician – pay $53,000 and $43,000 per year, respectively, both tens of thousands of dollars less than what the typical oil and gas worker makes. More than two-thirds of solar panel installation jobs are also temporary contract-based positions. These are just a few reasons why a recent survey of by a group of trade unions finds oil and gas jobs are viewed by skilled tradespeople as better paying and better long-term employment prospects than their renewable energy counterparts.
And when suggesting oil and gas workers can just go make solar panels, Kerry failed to mention that just one percent of solar panel manufacturing occurs in the United States. China (surprise, surprise) dominates the renewable infrastructure manufacturing industry and also has a near monopoly on the minerals that must be mined to manufacture renewable energy infrastructure. As Politico recently reported, “It’s a dirty truth. The U.S path to clean energy goes straight through China. … which controls a vast share of the minerals used in electric batteries, the cheap materials that make up solar panels and the guts of wind turbines.”
Common sense tells us we are going to need a lot of oil and gas for many years to come and that it’s imperative to produce as much of it here in the United States as possible. That cannot happen without the continued presence of a robust, experienced and skilled U.S. oil and gas industry workforce. That is why the “just transition” narrative is not only being met with skepticism by oil and gas workers, but a lot of pragmatic observers, in general.
Updated Report: Illinois Oil & Gas Reserves Generated $98.6M in Property Tax Revenue From 2007-2019
Note: This blog was updated with 2019 revenue on March 4, 2021.
Many Illinoisans may not be aware that the state’s active oil and natural gas production leases are assessed and taxed as real estate, similar to property taxes paid on a residential home. All of the revenue collected from this tax – known as an ad valorem tax – stays at the local level and goes directly to support the areas where oil is produced, including counties, villages, townships, cities, and – most importantly – local schools.
An IPRB review of the latest Illinois Department of Revenue (DOR) data shows that Illinois oil reserves generated $98.6 million in ad valorem tax revenue from 2007 to 2019, an average of more than $7.5 million per year. IPRB details this revenue in an updated annual report that can be downloaded here.
Typically, at least half of ad valorem property tax revenue is used to fund public education, while the remaining monies are used to fund various local public services. That fact noted, IPRB conservatively estimates that Illinois oil reserves generated at least $49.3 million in ad valorem tax revenue for schools in producing counties from 2007-2019. This revenue is all the more significant considering Illinois public schools were woefully underfunded by the state during this time frame, placing even more burden at the local level.
Ad valorem tax revenue from Illinois oil production has a particularly significant impact in major producing counties. IDOR data show that ad valorem tax revenue in Illinois’ top-15 oil producing counties totaled $87.9 million from 2007-2018, an average of more than $6.7 million per year.
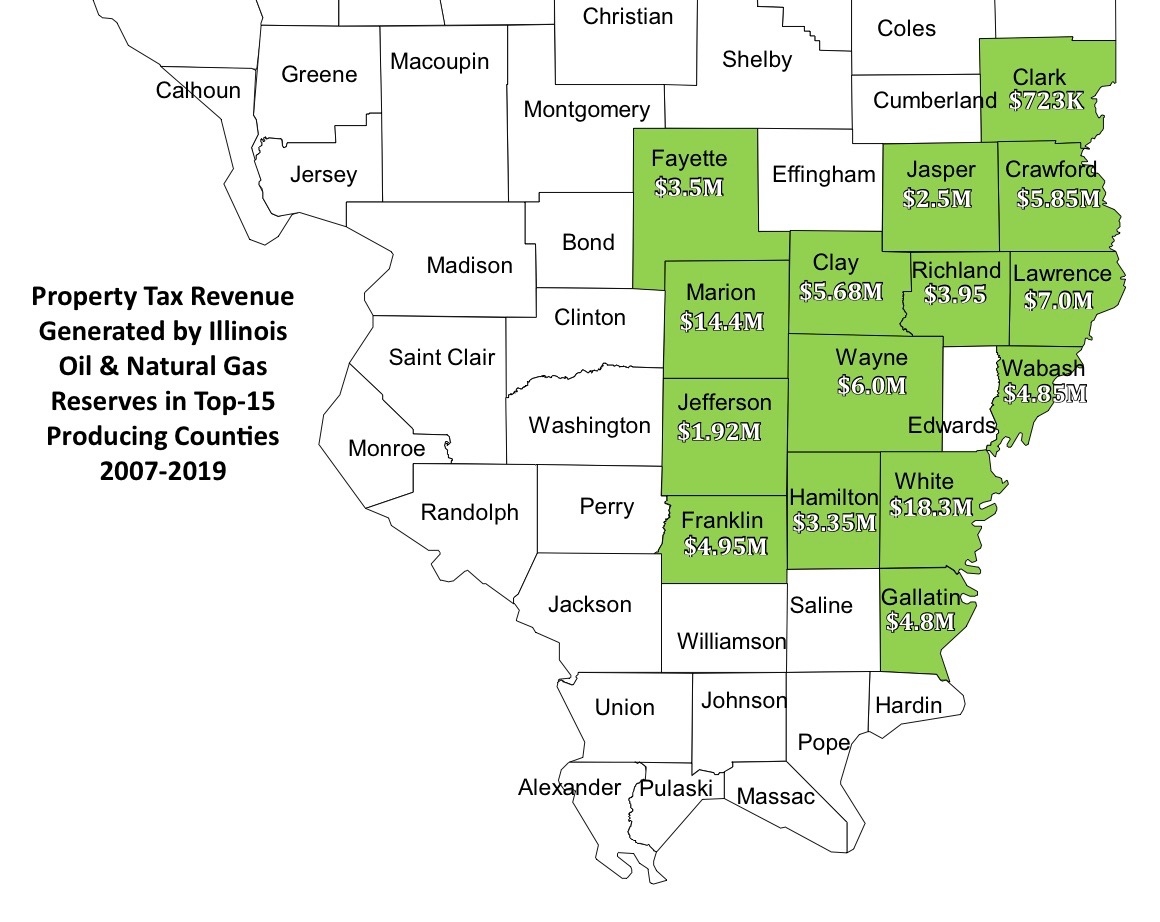
IPRB conservatively estimates that at least $43.9 million of that revenue went to public schools in those top-15 producing counties.
It is important to note that many of these counties have relatively small populations and are relatively poor compared to many other state counties and the state as a whole. In fact, all but one of Illinois’ top oil producing counties (Crawford) have poverty rates that are higher than the national average – adding even more significance to the ad valorem tax revenue generated by oil and natural gas reserves in these counties. Just two percent of Illinois’ overall population resides in these top-15 producing counties, which are responsible for 90 percent of Illinois oil production.
Here are county-level breakdowns for Illinois’ top-15 producing counties featured in IPRB’s report:
- White County
- Marion County
- Crawford County
- Lawrence County
- Fayette County
- Wabash County
- Wayne County
- Clay County
- Wayne County
- Franklin County
- Richland County
- Clark County
- Jasper County
- Hamilton County
- Gallatin County
- Jefferson County
It is important to understand that these taxes are based on estimates of oil and gas reserves remaining in the ground, not oil and natural gas produced. The annual ad valorem tax bill that operators and royalty owners receive is also based on data that is over two years old. For example, ad valorem taxes paid in 2017 were based on a 2016 assessment of active leases that is calculated using 2015 production totals. There are also reductions for leases based upon lease age, secondary recovery methods used and production.
As complicated as the ad valorem tax calculation system may be, it is clear that these taxes are generating significant revenues in the communities where they operate, specifically for local schools.
Illinois Oil Production Totaled 7.51 Million Barrels in 2020
 Illinois crude oil production totaled 7,513,835 barrels in 2020, according to data compiled by the Illinois Petroleum Resources Board (IPRB) that is based on first-purchaser reports. Click here to view IPRB’s annual Illinois oil production report.
The state’s 2020 oil production was 8.9 percent below 2019 levels. A similar production drop was observed throughout the United States, as the COVID-19 pandemic-induced oil demand and price shock led to national production dropping 8.1 percent, from a record 12.3 million barrels per day in 2019 to 11.3 million barrels per day in 2020.
Though production was down significantly overall in Illinois last year, monthly production levels trended upward in the second half of the year as oil prices recovered modestly following the worst of the demand and oil price shock in the spring.
White County – by far the state’s top-producing county – actually saw strong production growth in 2020 despite the pandemic. White County oil production totaled 2,206,100 barrels in 2020 – a 7.6 percent increase from 2019 levels. White County has now topped 2 million barrels of production two years in a row and accounted it for just under 30 percent of the state’s production last year. White County’s annual production has more than doubled from levels seen just a decade ago.
The state’s top-15 producing counties – White, Marion, Crawford, Lawrence, Fayette, Wabash, Clay, Wayne, Franklin, Clark, Hamilton, Richland, Jasper, Gallatin and Jefferson – collectively produced 91 percent of the state’s oil in 2020. All 15 of those counties – as well as Edwards, Brown and Effingham counties – have recently passed Resolutions of Support for the Illinois oil production industry.
Report: Illinois Oil & Gas Industry Represented 3% of State’s Economy in 2020
Most folks probably don’t think of Illinois as a major oil and natural gas industry state. But the recently released Texas Independent Producers and Royalty Owners Association (TIPRO) 2021 State of Energy Report shows that perception doesn’t always align with reality.
Even coming off possibly the toughest year the industry has ever faced, the report finds that the Illinois oil and natural gas industry – including the upstream, midstream and downstream sectors – was responsible for $22 billion in Gross Regional Product (GRP) in 2020, representing three percent of the Land of Lincoln’s overall economy. The following Illinois fact sheet was featured in the report.

According to the report, the Land of Lincoln had 16,374 direct oil and natural gas industry jobs in 2020, placing it among the top-10 states in direct oil and natural gas industry employment. The report also shows Illinois oil and natural gas industry jobs pay an average of $104,840 a year – 65 percent higher than the private sector average. These are just a few of the many reasons Gov. JB Pritzker designated the oil and natural gas industry as “essential” when COVID-19 pandemic restrictions were first implemented. Illinoisans not only rely on the essential products and services our regional oil and natural gas industry provides, the industry itself is a major economic engine and employer in the state.
The TIPRO report tallies 1,741 Illinois upstream oil and natural gas industry jobs in 2020, a figure that does not include hundreds of non-payroll independent contractors that are not captured in the U.S. Bureau of Labor Statistics data used as the primary employment source of the report. Using the most recent U.S. Census Bureau Non-Employer Statistics Report, IPRB conservatively estimates more than 3,200 were directly employed in the Illinois “upstream” oil production industry last year. The upstream Illinois oil and gas industry also indirectly supports thousands of other jobs. The Economic Policy Institute estimates that the oil and natural gas extraction industry has one of the highest indirect job employment multipliers, where one direct job leads to an additional 5.43 indirect jobs.
Not surprisingly, the TIPRO report finds that Illinois upstream oil and natural gas production industry jobs were down 19 percent last year. The oil price demand and price shock created by the COVID-19 pandemic had an even bigger negative impact nationally, as upstream jobs were down 24 percent across the country. There were 359,410 upstream jobs (not including non-payroll independent contractors) in the U.S. last year, down 112,348 jobs compared to 2019. Oil and gas support and service industry jobs were hit particularly hard, down 77,393 jobs from 2019 (192,163).
Despite an undeniably tough year, direct U.S. oil and natural gas industry jobs still totaled 902,223 in in 2020, paying 86 percent higher than the private sector average ($113,601).
On the state level, the report also shows that there were 342 upstream oil and natural gas businesses in Illinois in 2020 and that 25 percent of the state’s oil and natural gas industry workforce is 55 or older, indicating there will be strong job demand going forward as a large share of the state’s workforce is at or near retirement age.
Check out IPRB’s recently updated Illinois oil and natural gas industry “By the Numbers” fact sheet for a snapshot of the importance of the industry in the state.
Draft DOE Study Indicates Illinois Basin Oil Production Methane Emissions Are Negligible
Preliminary results from a long-awaited U.S. Department of Energy marginal well methane emissions study have been released, and they confirm what even the Obama-era EPA acknowledged back in 2015: methane emissions from marginal production sites are “inherently low.”
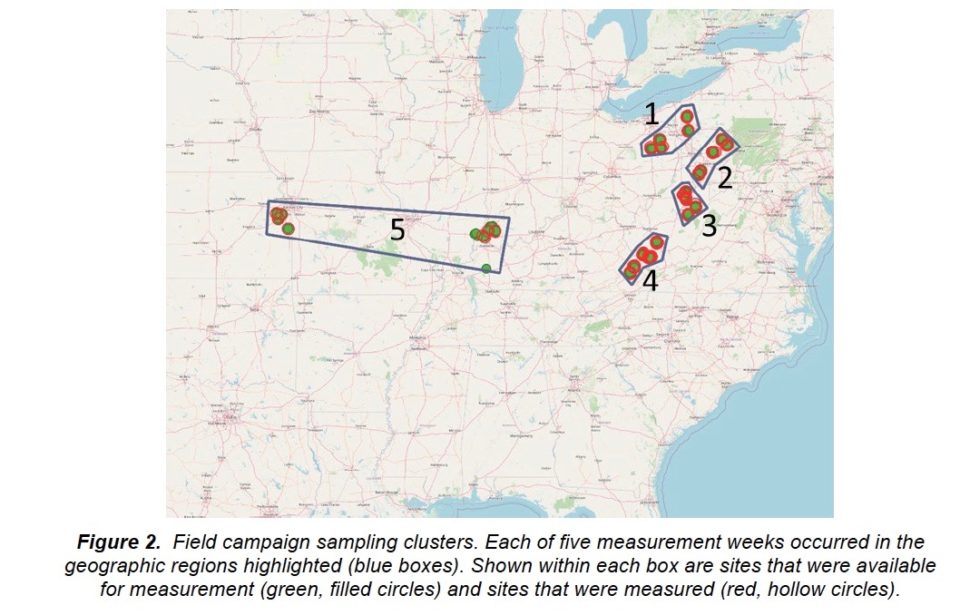
The draft report – which was commissioned to fill a gaping data gap for wells that produce 15 barrels of less of oil per day or 90,000 cubic feet or less of natural gas per day – includes full results from first field campaign of the study, which included Illinois Basin marginal oil production sites. The Illinois Basin portion of the study is identified on the right side of the area labeled “5” on the following map featured in the draft report (view two-page summary here).
Among the most notable takeaways from that field campaign that included the Illinois Basin were:
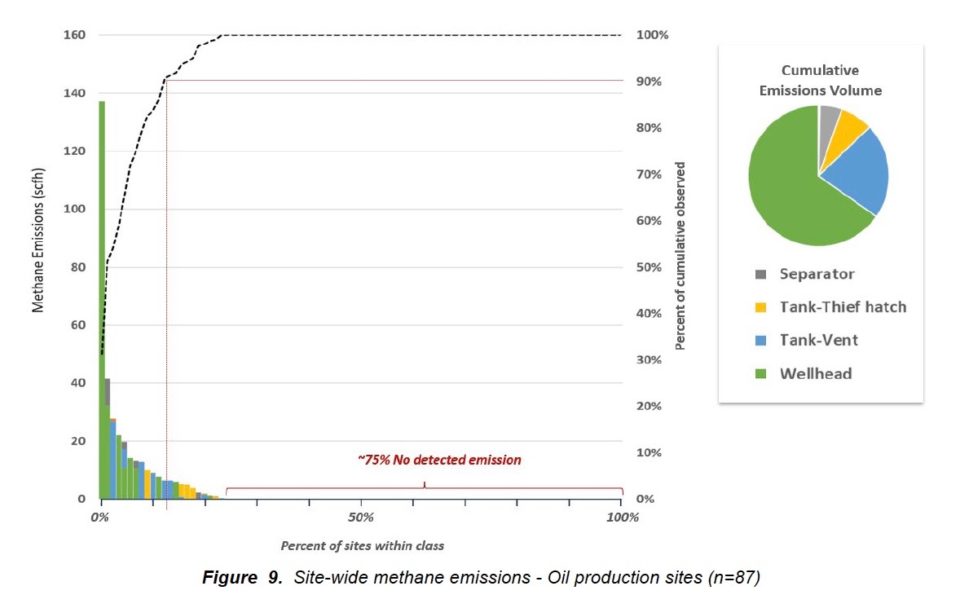
- 75 percent of the 87 oil sites evaluated had no detected emissions at all
- 90 percent of observed emissions were less than 13 standard cubic feet per hour
- 90 percent of emissions detected were from 12 percent of the sites
- Two sites – an oil well that had a sucker rod packing issue on its pump jack (137 scfh) and a natural gas well with an open hole in the wellhead casing (156 scfh) – accounted for 40 percent of the overall emissions detected
It should be emphasized that the results are preliminary and the final report, which has been delayed by the COVID-19 pandemic, is slated to be released in September 2021. However, the Illinois Basin field study portion of the report is complete, with the data presented in the draft version of the report providing the most definitive methane emissions profile of the Illinois Basin to date. And that profile shows methane emissions from the Illinois Basin are negligible. The following graphic summarizes the oil production site findings from the field campaign that included the Illinois Basin.
With regard to the field campaign that included the Illinois Basin specifically, the report notes:
“Overall, emission rate measurements from Field Campaign 1 [which included the Illinois Basin] exhibit the long-tail behavior commonly observed in air emissions studies (see Figures 6 and 7 in Section 3.6). Approximately 90% of the observed emissions were less than 13 standard cubic feet per hour (scfh), and 95% of the observed emissions were less than 25 scfh. The top 10% of emission sources contributed 72% of the total emissions observed…”
Why It Matters
The Obama administration eliminated the marginal well exemption from its 2016 methane rule despite the Obama-era EPA acknowledging in 2015 that methane emissions at marginal wells are likely “inherently low.” In absence of significant marginal well emissions data, the Obama-era EPA in 2016 began extrapolating reported leakage rates from larger facilities onto smaller facilities, basing this methodology on the flawed notion that they have similar leakage rates. Put another way, the decision to eliminate the marginal well exemption was justified largely by assumed proportion of total production emitted from marginal wells rather than actual total emissions.
The Obama-era decision to eliminate the marginal well exemption from the methane rule was also made despite the fact that there was no significant research on marginal wells that was sufficient enough to justify the need for doing away with the exemption. That is the primary reason the DOE/GSI Environmental marginal well methane study was commissioned during the Trump administration. As the draft version of the DOE report notes:
“Seventeen peer-reviewed papers published between 2010 and 2019 include evaluations of site-level emission measurements or estimates from approximately 9,000 production sites including approximately 25,000 wells spread across 13 major basins. Of this population, approximately 3,500 of the sites may be considered marginal and predominantly represent natural gas production, with very little representation of oil production.”
The preliminary results of the study show that the environmental benefit of marginal wells being subject to the methane rule would likely outweigh the significant financial costs the elimination of the exemption would have posed on small operators.
As the Obama-era EPA acknowledged in 2015, “many [marginal] well sites are owned and operated by small businesses.” The latter is especially true in the Illinois Basin, where there isn’t a single major publicly traded company with production operations and more than 90 percent of the state’s oil wells are marginal producers, compared to 70 percent of wells nationwide. In fact, a vast majority of Illinois oil wells are actually “stripper wells,” which are wells producing 10 barrels or less per day.
The Independent Petroleum Association of America has estimated that costs associated with purchasing equipment and needed to comply with the Obama-era methane rule would result in a total average price tag more than $78,000 per operator.
As the DOE report shows, such costs would not only prove incredibly burdensome for small producers already dealing with low commodity prices, the elimination of the marginal well exemption – which was recently re-instated by the Trump administration – would provide no climate benefit. Fortunately, the DOE report will better inform the marginal well methane emission debate moving forward.